November 2026 Tahoe-Truckee Real Estate Market Update
October sales
October volume
Median sale
Active listings
Months of supply
Volume through October
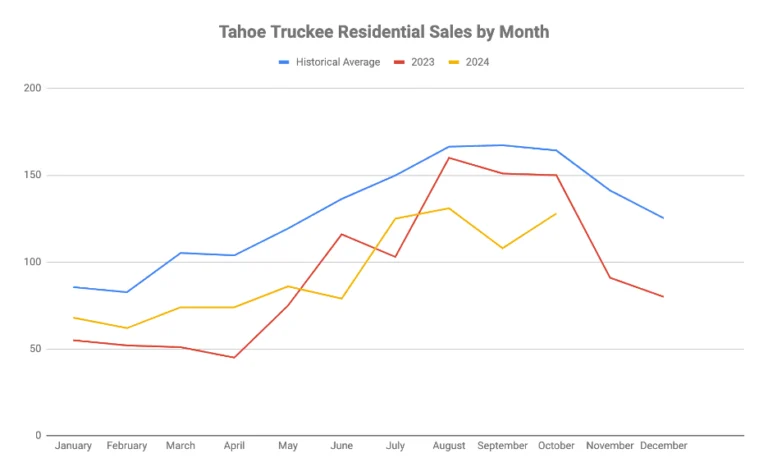
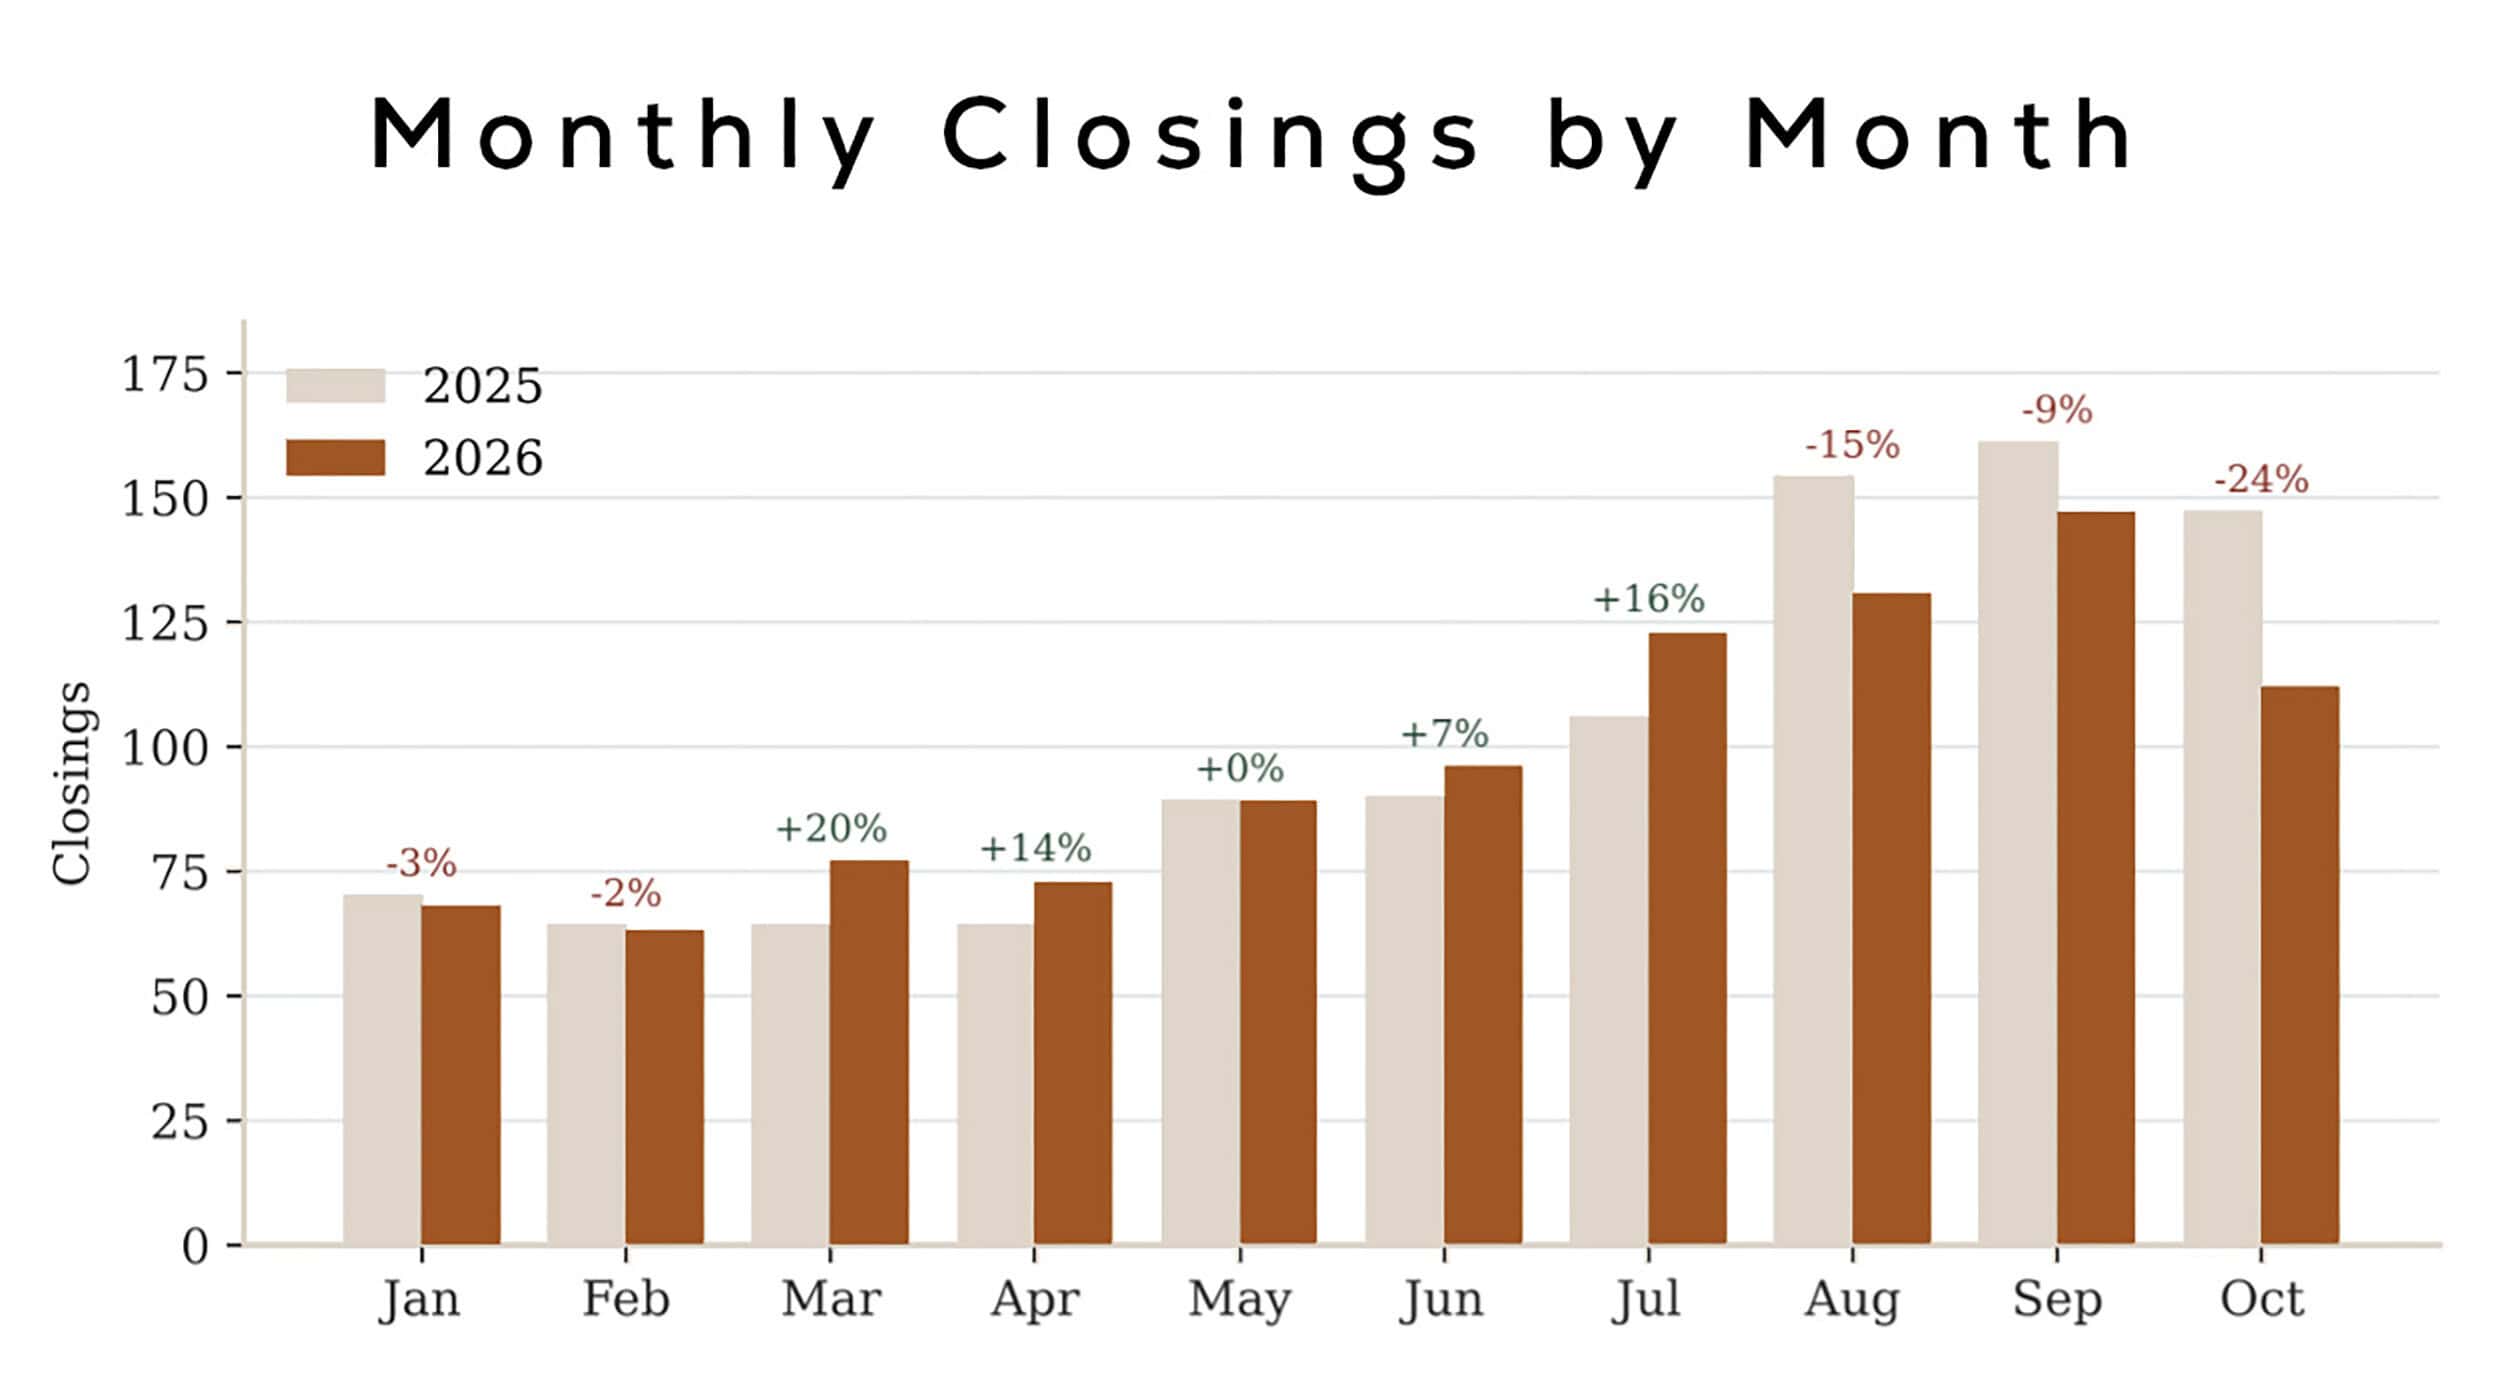
October brought fewer closings to Tahoe and Truckee, but the middle sale price rose. Tahoe Mountain Realty’s headline count was 112 sales totaling $194.6 million, with a median of $1.145 million. The median price per square foot reached $630, up from $596 a year earlier. The report uses 114 as the denominator in a separate discussion of time on market, so the two counts should be read separately.
Fewer sales, higher dollar volume for the year
Through October, 979 sales accounted for $1.86 billion. Compared with the same stretch in 2025, the number of sales fell 3% while dollar volume increased 2.9%. The average closing moved from about $1.79 million to $1.90 million. October had the largest year-over-year drop in closings of the three months from August to October.
The slowdown depended on price
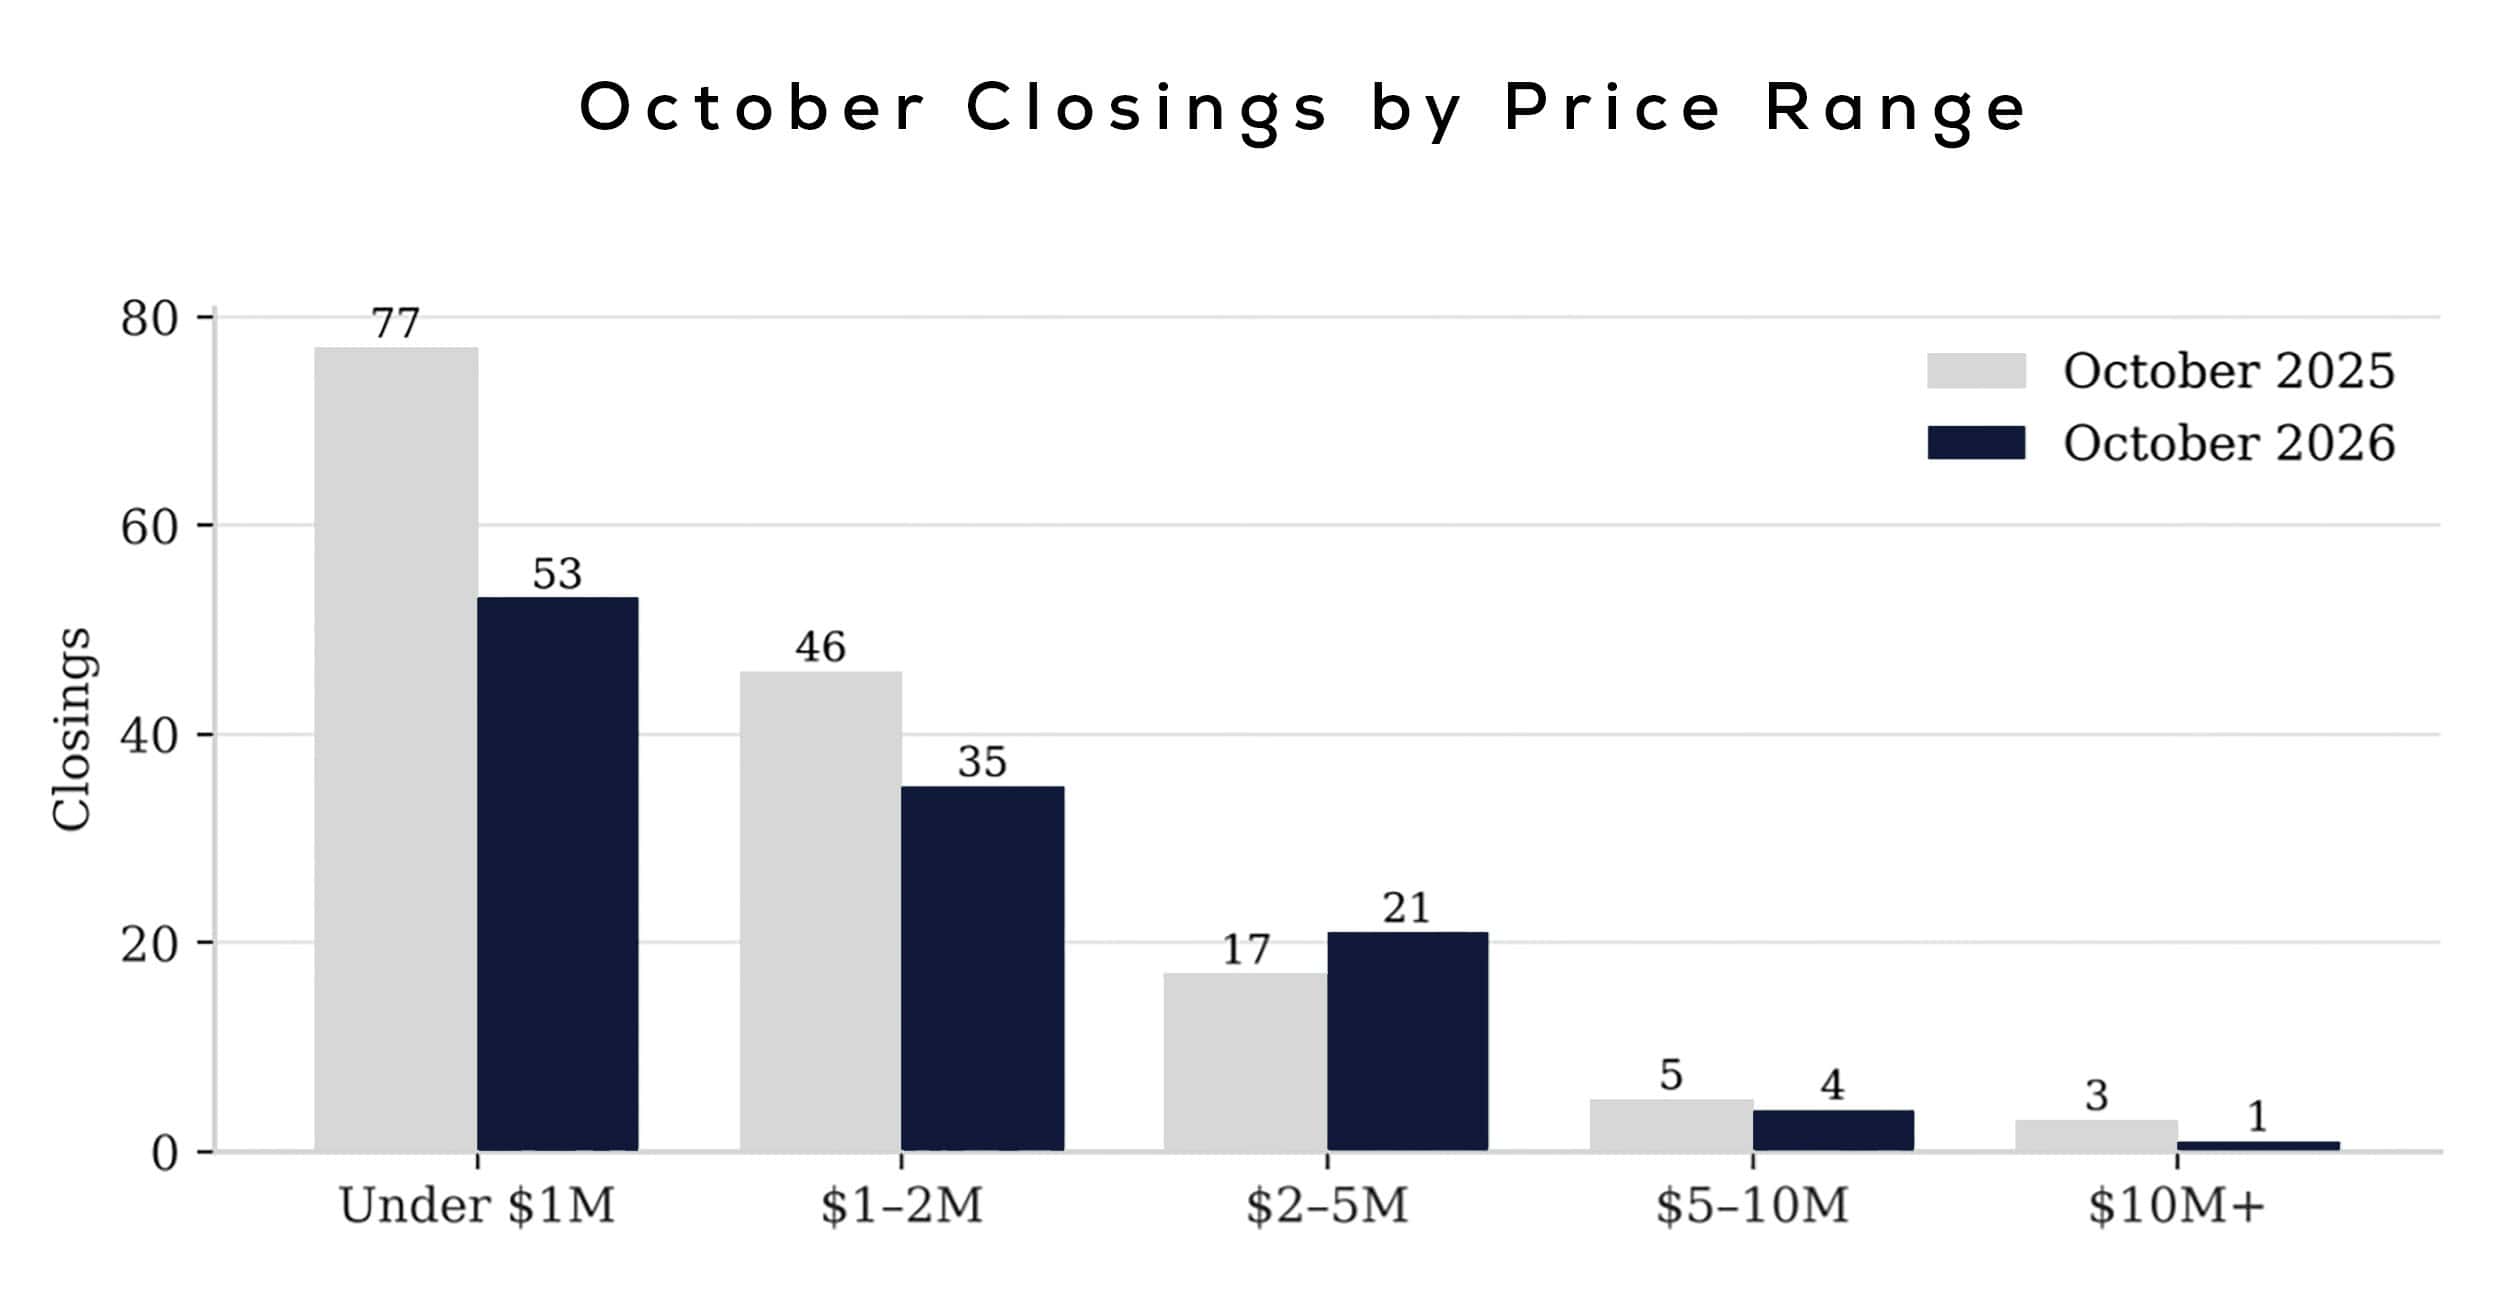
Sales under $2 million fell from 123 to 88 compared with last October. Sales from $2 million to $5 million increased from 17 to 21. TMR pointed to higher borrowing costs as a possible reason for the weaker activity in the lower price bands. For buyers, the split is a reason to compare recent sales in their own price range.
Inventory heading into winter
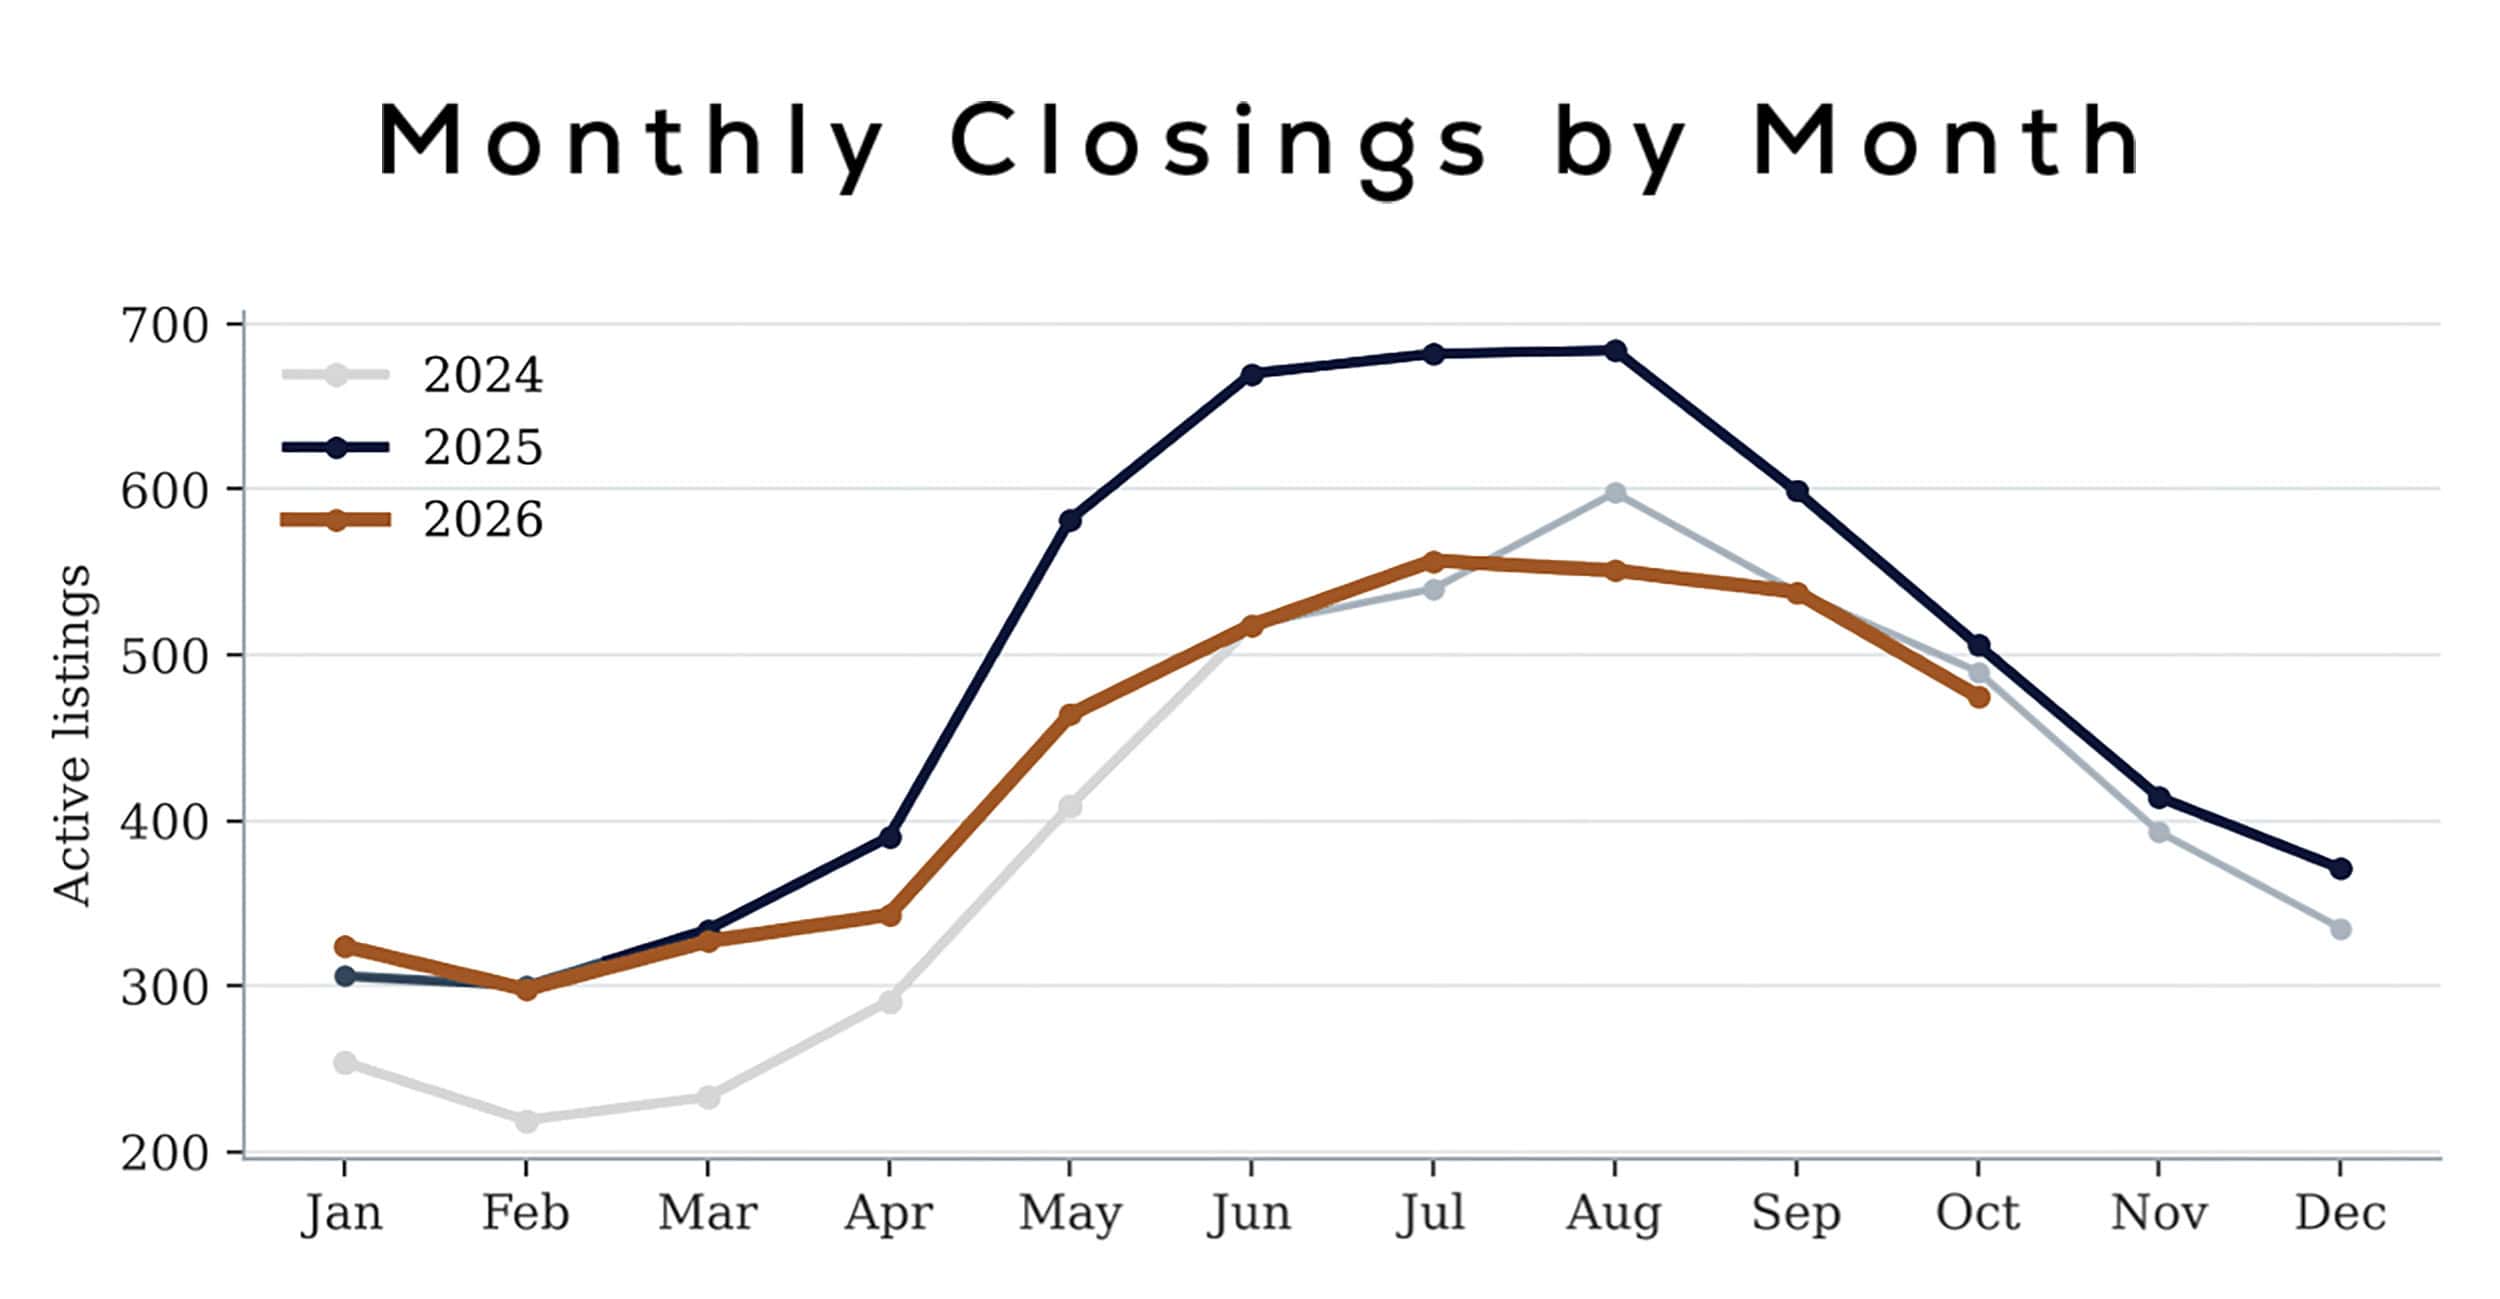
October ended with 475 active listings and 4.2 months of supply. That was down from 538 listings in September and about 6% below October 2025. This summer’s peak was 557 active listings, versus 684 the previous summer. Even with fewer buyers closing, the number of homes to choose from was still limited.
Incline Village passed last year’s dollar total
Incline recorded $565.9 million across 142 sales through October, already above the $533.4 million recorded in all of 2025. October contributed 14 sales and $54.1 million. Active listings fell from 87 in July to 58 in October. TMR tracks Incline separately, so these numbers should be read on their own.
How the communities compare
The scorecard combines January–August sales with October closings and an end-of-October inventory snapshot. The mix matters: Northstar houses and Village condos move at different speeds, while in Martis Camp the current asking prices sit well above several recent closings. In Lahontan and Schaffer’s Mill, check how long competing homes have been listed before drawing conclusions from the listing count.
| COMMUNITY | SALES JAN–AUG | OCTOBER CLOSINGS | LISTED NOW | MEDIAN ASK | MEDIAN DAYS LISTED | MONTHS SUPPLY | READ |
| Martis Camp | 24 | 1 · $6.43M | 9 | $14.0M | 130 | 3.0 | Asks above trades |
| Lahontan | 12 | 1 · $3.80M | 17 | $4.60M | 66 | 11.3 | Buyer’s choice |
| Schaffer’s Mill | 26 | 1 · $4.65M | 16 | $4.20M | 120 | 4.9 | Pace supports supply |
| Gray’s Crossing | 10 | 2 · $2.42M–$3.30M | 13 | $3.00M | 98 | 10.4 | Thin above $3.2M |
| Old Greenwood | 4 | 0 | 3 | $1.43M | 41 | 6.0 | Little to buy |
| Northstar Homes | 17 | 3 · $1.75M–$2.55M | 16 | $2.79M | 53 | 7.5 | Fastest closings |
| Northstar Village | 8 | 2 · $0.78M–$2.43M | 21 | $1.25M | 104 | 21.0 | Deepest supply |
| Incline Village | 110 | 14 · $54.1M | 58 | — | — | 4.2 | Ahead of 2025 |
October closings to compare
A $3.8 million closing on Elias Baldwin in Lahontan worked out to about $640 per square foot after 54 days. A Gray’s Crossing home on Henness Road closed for $3.3 million with zero days recorded on market. A Northstar Village property on Northstar Drive closed at $2.425 million after 350 days. Those are three very different marketing histories in the same month.
What to watch through year-end
TMR modeled two paths for the last two months of the year: 167 closings if October’s pace holds, or 212 if activity returns to its year-to-date pace. Those scenarios imply full-year volume of roughly $2.16 billion to $2.25 billion. Watch new contracts and price reductions for signs that buyers and sellers are finding common ground.
| SCENARIO | NOV–DEC CLOSINGS | FULL-YEAR CLOSINGS | FULL-YEAR VOLUME |
| October’s pace holds (−24% units, −20% volume vs. 2025) | 167 | 1,146 | $2.16B |
| Year-to-date pace returns (−3% units, +3% volume) | 212 | 1,191 | $2.25B |
| 2025 actual | 219 | 1,228 | $2.18B |
Buying a home that fits your Tahoe life
If pickleball is part of your week, let’s look at the drive to the courts you’d actually use, along with the price, condition and recent sales of each home. I can help you compare neighborhoods and check court access before you make an offer.
Talk with Cleve about your Tahoe home search.
Source and charts: Tahoe Mountain Realty’s November market update.